J. Biosci. Public Health. 2025; 1(1)
Corresponding Author *
![]() https://orcid.org/0000-0002-1573-8281
https://orcid.org/0000-0002-1573-8281
Affiliations:
Department of Public Health and Informatics, Jahangirnagar University, Savar, Dhaka-1342, Bangladesh
Corresponding Author *
![]() https://orcid.org/0000-0002-1573-8281
https://orcid.org/0000-0002-1573-8281
Affiliations:
Department of Public Health and Informatics, Jahangirnagar University, Savar, Dhaka-1342, Bangladesh
Coauthor
![]() https://orcid.org/0009-0005-2592-3375
https://orcid.org/0009-0005-2592-3375
Affiliations:
Department of Public Health and Informatics, Jahangirnagar University, Savar, Dhaka-1342, Bangladesh
This study evaluated nutritional knowledge, daily caloric intake, and BMI among tea garden workers in Sylhet, Bangladesh. Using a cross-sectional design, face-to-face interviews were conducted with 410 workers (final sample: 390) from January to May 2023. Data included socio-demographics, anthropometric measurements, and dietary assessments. The final sample included 390 participants with a mean age of 35.78 years. Results revealed a mean BMI of 19.64 (SD=3.27), with 39.2% underweight and 7.2% overweight/obese. Nutritional knowledge was poor (79.7%), and mean daily caloric intake (1795.58 kcal) fell significantly below optimal levels. Young adults were less likely to be underweight than older adults. Income level was a significant factor, as workers earning <4000 BDT were more likely to be underweight or overweight. Lack of formal education was associated with a higher likelihood of being overweight, while poor nutritional knowledge was linked to underweight status. Gender and family size also influenced caloric intake, with females and larger families at greater risk of malnutrition. The study underscores the need for targeted interventions addressing education, income, and dietary awareness to improve nutritional health in this marginalized workforce.
Nutrition is key to maintaining an active lifestyle and good health, which is best achieved through a varied, well-balanced diet that includes the right amounts from each food group [1]. Poor nutritional knowledge can lead to unhealthy dietary choices, with access to nutritious food and understanding of a healthy diet varying widely among different populations, especially in low-income communities [2]. Bangladesh has one of the oldest tea industries, with a long history, and it continues to be a key source of employment, contributing significantly to the organized labor force [3]. As of 2017, the annual report from the Bangladesh Tea Board indicated that 440,743 individuals, including workers and their families, lived in 159 tea gardens nationwide. Among them, 100,191 were permanent workers, comprising 48,611 men and 50,144 women [4]. Tea garden workers can be defined as individuals who are involved in the cultivation, harvesting, and then processing of tea leaves in a tea garden that is involved in tea plantation commercially [5]. The first commercial tea garden in what is now Bangladesh, and indeed one of the earliest in South Asia, was established in Malnichhara, Sylhet, in 1854 during the British colonial period [6]. The workers in this sector came from a variety of racial and ethnic backgrounds, as well as from different languages, cultures, and famine-stricken areas of India [7]. The majority of Bangladesh's tea is produced in four key districts—Sylhet, Moulvibazar, Habiganj, and Chittagong—with the largest portion cultivated in the northeastern Sylhet Division. This region experiences consistently heavy rainfall, creating an ideal climate for tea cultivation [6].
In Sylhet district, almost 74% of tea garden workers live below the poverty line [4]. Many are descendants of laborers brought by British colonial rulers, and they remain isolated in remote estates with limited access to health care, education, and nutritional resources. Therefore, tea garden workers, as a whole, lack access to fundamental human rights such as housing, nutrition, clothing, healthcare, education, and more [8]. With a daily wage of TK. 120 ($1.25), tea garden workers were the lowest-paid workers in the country until the end of 2022. However, following a protest demanding a 150% increase in pay, their daily wage increased to TK. 170 ($1.45) [4]. This sum is insufficient to cover basic needs, as it cannot even procure a liter of edible oil and coarse rice for their families in a day. Consequently, it becomes challenging for them to prioritize nutrition and meet other essential requirements with such limited income.
In order to achieve middle-income status and eradicate poverty, it is crucial to enhance labor productivity by ensuring proper wages and meeting the basic needs of tea garden workers.
Tea garden workers represent one of the most isolated and marginalized communities in Bangladesh. Historically disadvantaged and socioeconomically deprived, this group is often overlooked in national development programs and excluded from mainstream health and nutrition surveys. As a result, their specific health challenges—particularly those related to nutrition—remain largely undocumented in national health policy frameworks. National surveys such as the Bangladesh Demographic and Health Survey (BDHS) and the National Nutrition Services (NNS) frequently fail to disaggregate data for occupational subgroups like tea garden workers, leaving a significant evidence gap [9].
In the context of Bangladesh’s commitment to the Sustainable Development Goals (SDGs)—notably SDG 2 (Zero Hunger) and SDG 3 (Good Health and Well-being)—it is imperative to address the needs of marginalized occupational groups to ensure that no one is left behind [10]. Given this background, a thorough investigation into the living conditions, dietary practices, and nutritional health of tea garden workers is essential. Assessing factors such as nutritional knowledge, daily caloric intake, and body mass index (BMI) can provide meaningful insights into their overall health and livelihood status.
Therefore, this study aims to evaluate the nutritional knowledge, daily calorie intake, and BMI of tea garden workers in the Sylhet district of Bangladesh. The findings will help uncover disparities in dietary practices and nutritional status, offering critical evidence for the formulation of inclusive public health interventions and occupational health policies.
Study Area
A cross-sectional study was conducted between January and May 2023 on tea garden workers from four tea estates in Sylhet, Bangladesh (Malnicherra Tea Estate, Khadim Tea Estate, Burjan Tea Estate, and Cherragong Tea Estate).
Sample Size Calculation
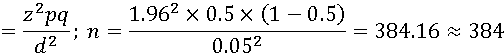
The sample size was determined using Cochran's sample size equation [11]:
| Here, n = number of samples z = 1.96 (95% confidence level) p= prevalence estimate (50% or 0.5) (as no study found) q = (1-p) d = Precession of the prevalence estimate (10% of 0.05) |
Here, the minimum sample size is 384. However, 390 data was taken for analysis for increasing the study’s strength [12,13].
Study Design and Data Collection
The study employed a cross-sectional survey design, utilizing face-to-face interviews conducted from January to May 2023. Convenience sampling was utilized, resulting in an initial sample of 410 individuals. An equal number of participants were randomly selected from each of the four tea gardens to ensure balanced representation. After excluding incomplete responses, the final analysis involved 390 surveys. The survey tool was adapted from validated questionnaires [14–16] to assess BMI, nutritional knowledge, and daily caloric intake. A pilot test (n=20) evaluated clarity and acceptability, with revisions made based on feedback. The finalized questionnaire was reviewed by experts for relevance. Written informed consent, including study details and voluntary participation, was obtained from all participants. For illiterate respondents, consent was secured through local guardians and garden authorities. Inclusion criteria required participants to be adult (≥18 years) Bangladeshi tea workers willing to participate; minors and unwilling individuals were excluded. Trained research assistants ensured data accuracy and confidentiality throughout the study.
Measures
The questionnaire included informed consent and multiple sections (i.e., socio-demographic information, nutritional status, dietary knowledge, and calorie intake-related information) and was utilized to collect data during the interview periods.
Sociodemographic Information
Some questions related to socio-demographics were asked during the survey, including age (later categorized as young adults (18 to 39 years)/older adults (more than or equal to 40 years)), gender (male/female), marital status (married/unmarried), religion (Hindu/Muslim/Christian), education level (no formal education/primary/high school or above), monthly family income (<4000BDT/4000-4999BDT/≥50000BDT [BDT=Bangladeshi Taka]), and family type (nuclear/large).
Body Mass Index (BMI)
For calculating BMI, anthropometric measurements were taken from the workers. In anthropometric, the worker’s height and weight were taken. Standing height was measured using precise scales (Detect-Medic, Detect Scales INC, USA) with an accuracy of 0.5 cm. Weight was measured barefoot and wearing lightweight clothing using a handheld scale with an accuracy of 0.5 kg. Then BMI was interpreted according to WHO’s standard BMI chart for adults [17].
Nutritional Knowledge
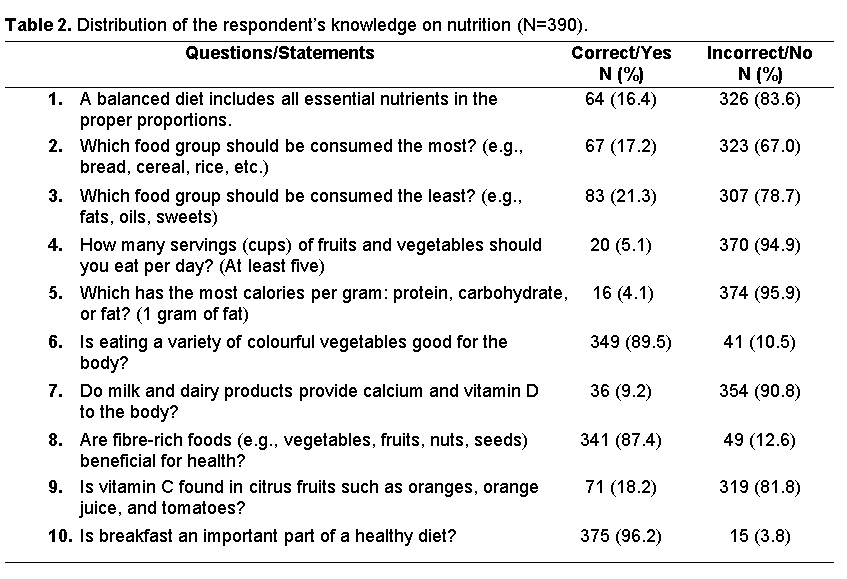
To measure workers nutritional knowledge, they were asked 10 diet- and nutrition-related questions, and their knowledge level was scored on a scale of 0-10 (Table 2). For every correct answer, point 1 was assigned, and for every incorrect answer, point 0 was assigned. The score was divided into three categories: poor knowledge with a score less than 50% {˂5}, moderate knowledge from 50% to 80% (5 to 8), and good knowledge more than 80% {˃8} [15,18].
Dietary Calorie Intake
To measure average daily calorie intake, a food frequency questionnaire was conducted, incorporating food items from 12 major food groups. Caloric intake is obtained from various food constituents, including cereals, meats, milk, eggs, pulses, oils, vegetables, fruits, and others. The nutrient composition of these food items was derived from WFP (1988) and USAID (2010) [19, 20]. During data collection, participants were asked to recall their food and beverage consumption frequency and amounts over the previous three months. The frequency and amount were recorded using the midpoint value of each category. To assess the responses, one month was considered equivalent to four weeks, and one week was defined as seven days. The intake frequency responses were then converted into times per day. For example, the range of 4-6 times per month was converted to five times per month and subsequently resolved to 1.25 (5/4 = 1.25) times per week and finally to 0.179 (1.25/7 = 0.179) times per day. The mean daily intake of each food (g) or drink (ml) was subsequently calculated through utilization of the following formula [21]:
[Average daily intake = intake frequency (times) per day × intake amount per portion size × weight of the portion size]
The total caloric requirement of the family members was determined through an assessment of the average Recommended Desired Intake (RDI) (kcal/capita/day) of food items, utilizing a rate of dietary needs equivalent to 2200 kcal/person/day [22]. The participants were then classified based on their caloric intake (per capita/day). Caloric levels were categorized into four groups: significantly below optimal (≤1800), below optimal (>1800-2122), optimal (>2122-2444), and above optimal (>2444) [19].
Statistical Analysis
Data analysis for this study was conducted using Microsoft Excel 2019 and IBM SPSS Statistics, Version 25.0 (Chicago, IL, USA). Microsoft Excel was utilized for data cleaning, editing, sorting, and coding. Subsequently, the Excel file was imported into SPSS software. Descriptive statistics, such as frequencies, percentages, means, and standard deviations, were calculated. Chi square test was performed to assess association between dependent and other variables. The study also utilized binary logistics regression and multinomial logistics regression to measure the strength of association. All statistical tests were considered significant at a 95% confidence interval, with a p-value less than 0.05.
Ethical Consideration
All procedures conducted in this study followed the guidelines for research involving human participants, including adherence to the Helsinki Declaration [23]. Informed written consent was obtained from each participant, clearly explaining the study's procedures, objectives, and the confidentiality of their information. Data were collected anonymously and analyses using numerical codes.
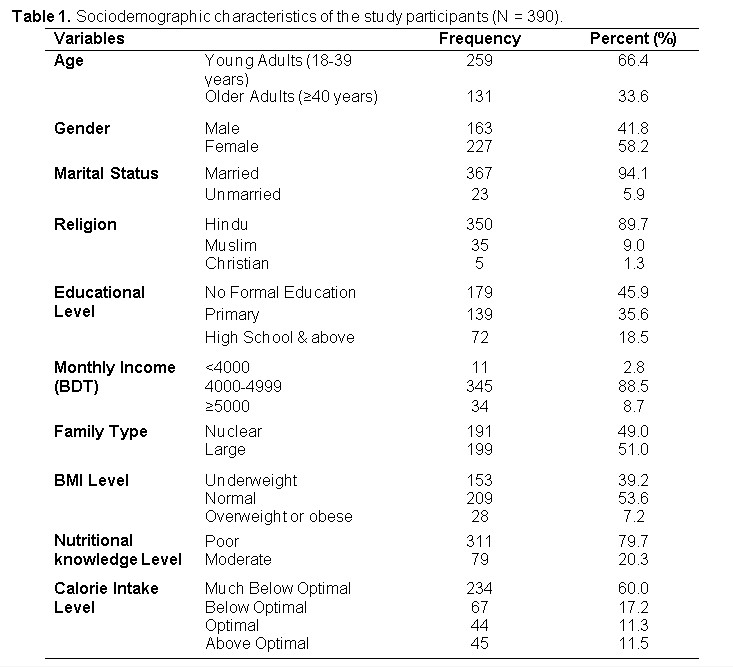
The present sample included 390 participants with a mean age of 35.78 years (SD = 10.744) and an age range of 18–67 years. Table 1 shows the distribution of sociodemographic characteristics among the study participants. Most participants were young adults (n = 259, 66.4%), female (n = 227, 58.2%), married (n = 367, 94.1%), Hindu (n = 350, 89.7%), had no formal education (n = 179, 45.9%), had a monthly income ranging from 4000 to 4999 BDT (n = 345, 88.5%), and had a joint or large family structure (n = 199, 51). The study also revealed that the majority of the participants had a normal BMI level (n = 209, 53.6%), poor nutritional knowledge (n = 311, 79.7%) and were much below their optimal daily calorie intake level (n = 234, 60%).
This study found the mean BMI score of the study participants to be 19.64 (SD=3.27) and the mean nutritional knowledge score to be 3.65 (SD=1.216) out of 10. Table 2 presents the distribution of respondents' knowledge on nutrition (N=390). The findings reveal that overall nutritional knowledge among participants was limited. A significant majority incorrectly answered key questions related to balanced diet (83.6%), food group consumption (67.0% and 78.7% for most and least consumed groups, respectively), and recommended servings of fruits and vegetables per day (94.9%). Only 4.1% correctly identified the macronutrient with the highest caloric value, and just 9.2% knew that milk and dairy provide calcium and vitamin D. However, awareness was higher regarding the benefits of eating a variety of colorful vegetables (89.5%) and fiber-rich foods (87.4%). Moreover, 96.2% recognized the importance of breakfast in a healthy diet. Respondents' mean calorie intake per day was found to be 1795.58 (SD=852.75) kcal, which falls into the much below optimal (≤1800 kcal) category. These results suggest a need for targeted nutrition education to address prevalent knowledge gaps.
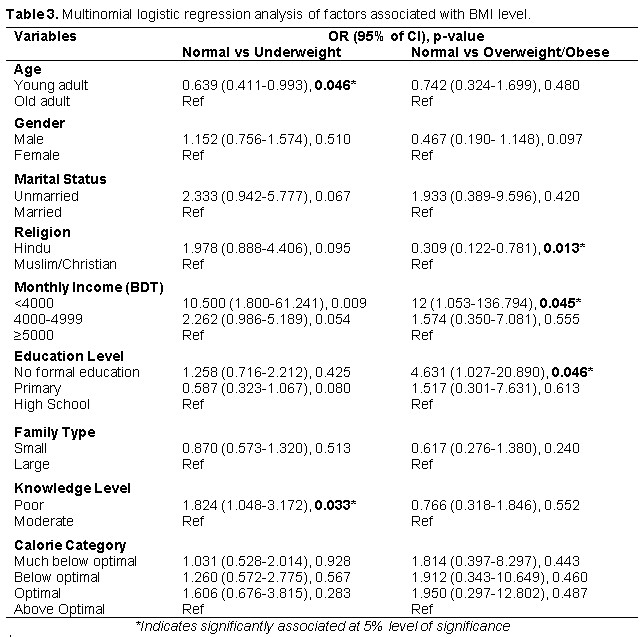
The multinomial logistic regression analysis identified several factors significantly associated with BMI categories (Table 3). Young adults were less likely to be underweight compared to older adults (OR = 0.639, p = 0.046). Religion was significantly associated with being normal weight versus overweight/obese, with Hindus less likely to be overweight/obese compared to Muslims/Christians (OR = 0.309, p = 0.013). Monthly income also showed a significant association; participants with a monthly income of <4000 BDT were significantly more likely to be underweight (OR = 10.500, p = 0.009) and overweight/obese (OR = 12, p = 0.045) compared to being in the normal weight category, relative to those earning ≥5000. Education level was another significant factor, with individuals having no formal education being more likely to be overweight/obese compared to those with high school education (OR = 4.631, p =0.046). Knowledge level was significantly associated with being normal weight versus underweight, with those having poor knowledge more likely to be underweight (OR = 1.824, p = 0.033).
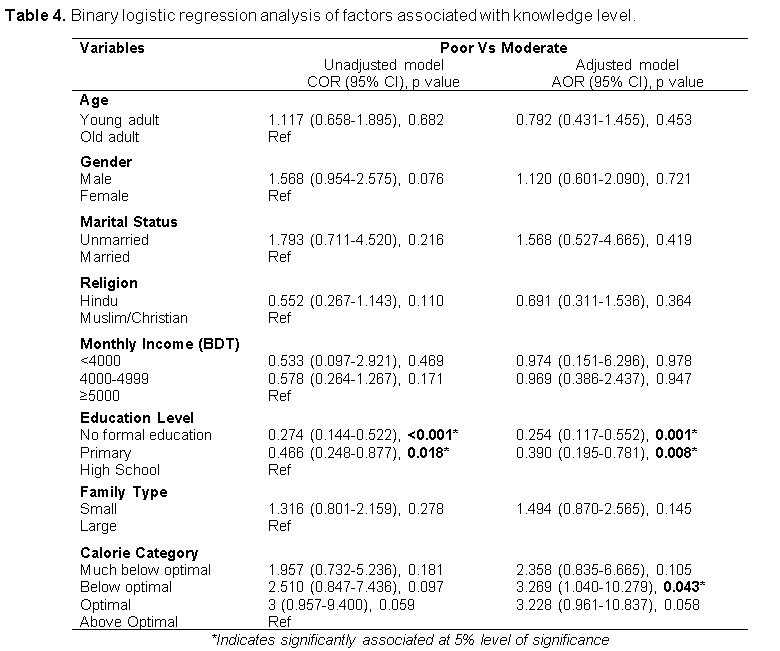
The binary logistic regression analysis between nutritional knowledge level and other variables found education level to be significantly associated with nutritional knowledge (Table 4). The analysis found participants with no formal education were less likely to possess moderate nutritional knowledge compared to those with high school education (OR = 0.274, p =<0.001), and individuals with primary education were also less likely to have moderate nutritional knowledge compared to those with high school education (OR = 0.466, p = 0.018).
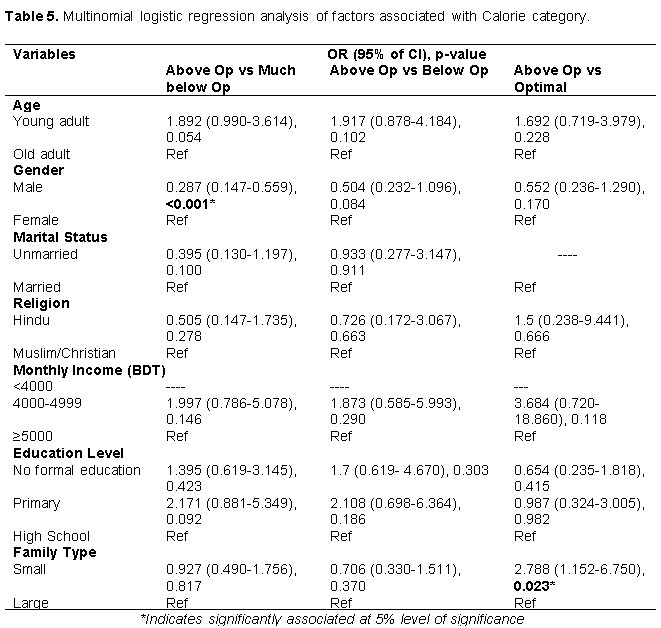
Variables such as gender and family type were found to be significantly associated with daily calorie intake level in our multinomial logistic regression analysis (Table 5). The analysis revealed that male respondents were less likely to fall much below optimal daily calorie intake compared to female respondents (OR = 0.287, p = <0.001). The study also revealed that participants with small (nuclear) family types were 2.7 times more likely to fall into the optimal calorie intake level compared to those with large family types (OR = 2.788, p = 0.023).
Increased nutritional knowledge has the ability to enhance the balance between the body’s calorie requirement and expenditure through altering eating habits [24]. Meal intake is thought to be influenced by the understanding of nutrition [25], and choosing healthier choices is influenced by knowledge provided to the people via schooling and nutritional advice [26]. Poor dietary intake causes multiple health issues. Protein and carb deficiencies in tea garden workers and their families lead to illnesses like coughing, fever, anemia, high blood pressure, and stomach and skin problems [27].
For a developing country, providing a sufficient amount of food regardless of culture, race, religion, wealth, and location is the greatest issue for all people [19], and this condition affects BMI category. This study found that sociodemographic factors like age, religion, income, education, and knowledge level affect BMI categories. Older adults were more likely to be underweight, aligning with prior research linking aging to lower BMI [28]. Malnourished workers notably suffer from anemia and other diseases, especially elderly workers [29, 30]. The results imply that socioeconomic variables, such as inadequate nutrition and educational attainment, make older individuals' nutritional problems worse [28, 31].
This study found overweight/obesity to be less common among Hindu workers than Muslims/Christians, reflecting socioeconomic factors affecting nutrition according to previous studies. Health disparities suggest an interaction between socioeconomic and religious influences on workers' health [29, 31, 32].
Workers earning less than 4000 BDT monthly were more likely to be underweight or overweight/obese, suggesting the impact of economic hardship on nutritional status [31]. Contrary to some studies, overweight/obesity was more common among those with no formal education, highlighting the role of education in nutrition awareness [33, 34].
The study found overweight/obesity was more common among individuals with no formal education, contradicting previous research linking obesity to higher education levels [31]. The lack of education that many tea garden workers have may make it difficult for them to comprehend nutrition and health [35]. Low education levels linked to overweight and underweight highlight the need for educational interventions to improve health and eating habits among tea garden workers [32].
Poor nutritional knowledge was associated with underweight status, reinforcing the link between health literacy and nutrition. High school-educated workers showed moderate knowledge, indicating a positive correlation between education and nutritional awareness [31]. Educational interventions could improve dietary behaviors among this population [31, 36]. Dietary awareness can be raised through educational initiatives, as high school graduates possess better nutrition knowledge than those with less education [37, 38].
This study found participants' mean calorie intake per day to be 1795.58 kcal, which is much less than the national average of 2393.0 kcal [22]. A strong link between gender and daily calorie intake was observed, with female workers consuming less than optimal levels, showing higher malnutrition rates [29]. This result can be linked to a number of issues, such as income disparities, because male workers tend to earn more than female workers, which prohibits women from accessing a healthy diet [37]. Workers from smaller families had better calorie intake, underscoring the influence of family size on food security and nutrition [31, 33].
Strengths and limitations of This Study
This study offers a novel and comprehensive look at nutritional knowledge, caloric intake, and BMI among impoverished tea garden workers in Sylhet, Bangladesh. However, several limitations exist. Convenience sampling may limit generalizability due to selection bias, while self-reported data are prone to recall and social desirability biases. The cross-sectional design prevents causal inference, and the absence of a comparison group and regional focus further constrain the findings. Future research should consider stratified random sampling, objective measures, and longitudinal designs for broader and more robust insights.
This study highlights significant disparities in BMI, nutritional knowledge, and daily caloric intake among tea garden workers in Sylhet, Bangladesh. Younger workers and those with higher income levels demonstrated better nutritional status, while older adults, individuals with lower incomes, and those lacking formal education were more prone to being underweight or overweight/obese. Poor nutritional knowledge was closely associated with underweight status, emphasizing the need for targeted educational interventions. Additionally, gender and family structure influenced daily calorie intake, with males and workers from smaller families more likely to achieve optimal intake. These findings underscore the importance of addressing educational and economic factors to improve the nutritional health of this vulnerable population.
We extend our heartfelt gratitude to everyone who contributed to the successful completion of this research project. We are especially thankful to the tea garden workers and authorities for their valuable time and willingness to participate in our interviews, making data collection possible. Our sincere thanks also go to our project supervisor and faculty member of the Department, whose guidance and support were instrumental in carrying out this study.
This research was conducted with self-funding. Therefore, any kind of financial support was not received for this study.
The authors declare no conflict of interest. All aspects of this research were conducted impartially and independently.
The study protocol was reviewed and approved by the Biosecurity, and Ethical Clearance Committee at Jahangirnagar University, Savar, Dhaka-1342, Bangladesh (Ref. No: BBEC, JU/M 2022/11 (95)). Participation was entirely voluntary, and respondents were assured of the confidentiality and anonymity of their information throughout the study.
 access