J. Biosci. Public Health. 2025; 1(2)
Corresponding Author *
![]() https://orcid.org/0009-0007-8888-7206
https://orcid.org/0009-0007-8888-7206
Affiliations:
Department of Biochemistry and Molecular Biology, Gono Bishwabidyalay (University), Nolam, Savar, Dhaka 1344, Bangladesh
Corresponding Author *
![]() https://orcid.org/0009-0007-8888-7206
https://orcid.org/0009-0007-8888-7206
Affiliations:
Department of Biochemistry and Molecular Biology, Gono Bishwabidyalay (University), Nolam, Savar, Dhaka 1344, Bangladesh
Coauthor
![]() https://orcid.org/0009-0008-6542-5161
https://orcid.org/0009-0008-6542-5161
Affiliations:
Department of Biochemistry and Molecular Biology, Gono Bishwabidyalay (University), Nolam, Savar, Dhaka 1344, Bangladesh
Coauthor
![]() https://orcid.org/0000-0002-0977-4593
https://orcid.org/0000-0002-0977-4593
Affiliations:
Department of Biochemistry and Molecular Biology, Gono Bishwabidyalay (University), Nolam, Savar, Dhaka 1344, Bangladesh
Significant knowledge gaps concerning the causes and risk factors of iron deficiency remain apparent among university students. Therefore, this study aimed to investigate the prevalence of iron deficiency anemia (IDA) among male and female university students and to explore the relationship of hemoglobin status with their food habits and mental health performance. Blood samples from 230 students (90 males, 140 females) were analyzed for hemoglobin and serum iron using colorimetric assays. Comprehensive data were collected through a structured questionnaire. Results show anemia rates were found to be 48.6% in females and 65.6% in males. Iron deficiency was present in 42.9% of females and 26.7% of males. Irregular meals were common. Hemoglobin levels were significantly linked to fruit intake in both males and females (p < 0.05) and to depression in males (p < 0.05). Many students reported sleeping problems, depression, and fatigue. 57.8% of participants were aware of anemia (p = 0.007), 55.2% recognized symptom
Iron deficiency anemia (IDA) is a health condition that can affect people of all ages, from infants to the elderly [1]. Worldwide, about 2.3 billion people are affected by anemia [2, 3]. The World Health Organization (WHO) defines anemia as hemoglobin levels of < 7.45 mmol/L (12 g/dL) in women and ≤ 8.07 mmol/L (13 g/dL) in males [4]. IDA is characterized by a lower concentration of hemoglobin in blood because there are either fewer red blood cells (RBCs) than normal or little hemoglobin in each cell [5]. That results in an insufficient oxygen supply to the organs and leads to various health issues, including fatigue, poor physical strength, muscle weakness, and shortness of breath [5–7]. Anemia can be classified as (ⅰ) microcytic, when the RBCs are smaller than normal, typically due to iron deficiency; (ⅱ) normocytic, normal cell size, but fewer in number due to acute blood loss; or (ⅲ) macrocytic, larger size than normal due to cyanocobalamin (B12) or folate deficiency [8, 9]. Malnutrition, particularly a deficiency in essential nutrients such as iron, riboflavin (B2), cyanocobalamin (B12), and folate, is a significant cause of anemia [10]. Iron is an essential element in all living organisms. The adult human body contains about ~ 4 g of iron. Almost two-thirds (75%) of the body's iron is found in the hemoglobin present in the circulating RBCs (erythrocytes), which is responsible for transporting oxygen to the cells [11, 12]. Hemoglobin is a conjugated protein, consisting of two parts: (ⅰ) a protein component (globin) and (ⅱ) a prosthetic group/a non-protein component (heme) containing iron [13]. Iron deficiency in the body limits the synthesis of heme, ultimately hemoglobin synthesis, leading to less production of RBCs in the bone marrow, resulting in microcytic anemia [11]. In Bangladesh, IDA is indeed a prevalent health problem in rural women and young children due to inadequate dietary iron intake [14]. The university students often obtain meals from residential dormitory, which may lack nutritional balance [15]. Moreover, irregular dietary habits are often influenced by several factors, such as poor time management, financial limitations, and a lack of interest in preparing meals. Sleeping late at night and avoiding breakfast had become a mess or a bad lifestyle; even those who had the habit of sleeping late did not have snacks before their sleep. Therefore, they were more likely to have a nutritional deficiency [16]. Despite their educational background, many students exhibit a notable gap in their knowledge regarding the underlying causes and risk factors associated with iron deficiency. Most of the students had a tendency to intake unhealthy oily foods such as samosa, and puffy (fuchka) during lunch break; also, some students intake junk food like potato chips, fried chicken, sweetened beverages, processed meat, mutton biryani, burgers, pizza, cakes, etc. Those foods provide a lot of calories with little nutritional value where essential vitamins, minerals, or fibers are missing [17]. A study reported that 55.3% of university students are anemic [15]. Another study conducted 22% (33 out of 150) were diagnosed as having any form of anemia [17]. IDA is a common yet overlooked issue among young adults. University students may be at risk due to poor dietary habits, irregular meals, and low awareness. Assessing hemoglobin levels, dietary patterns, and anemia-related knowledge can reveal the prevalence and risk factors, guiding targeted nutrition education and prevention strategies.
This study aims to determine the prevalence of IDA among university students and to explore the relationship of hemoglobin levels with dietary habits, and mental health. Additionally, it seeks to assess the participants’ level of knowledge and awareness regarding anemia through a structured questionnaire, thereby identifying gaps in nutritional practices and health education needs.
2.1. Study Design
This study employed a mixed-method cross-sectional design, incorporating both a structured questionnaire survey and clinical laboratory analyses. A total of 230 students participated, comprising males aged 19-27 years and females aged 18-25 years, representing diverse socioeconomic backgrounds.
2.2. Data Collection
Data were collected using a pre-tested, structured questionnaire managed randomly to participants. The questionnaire included items on dietary habits, socioeconomic status, demographic characteristics, and knowledge related to anemia. The aim was to assess the impact of anemia and iron deficiency on students’ mental health. Participants were informed about the objectives of the study and the experiments protocol.
2.3. Inclusion and Exclusion Criteria
Eligible participants were apparently healthy students enrolled at the university during the study period. Individuals with a self-reported or clinically confirmed history of anemia or other hematological disorders were excluded. Pregnant female students were also excluded to minimize confounding factors.
2.4. Knowledge Assessment
Knowledge regarding anemia was evaluated through a scoring system, and standardized z-scores were calculated using the following formula:

where X represents the individual score, μ is the mean score of the group, and σ is the standard deviation.
2.5. Sample Size Calculation
A convenience sampling technique was applied, with random selection of respondents from the available undergraduate students. Following formula was used to determine the sample size,
Here, n = required sample size, Z = Z-score for confidence level (1.96 for 95%)
P = estimated proportion/prevalence (0.5), d = margin of error (0.05)
Due to inconsistent findings on the prevalence of anemia and the lack of recent data, the sample size was estimated using an assumed prevalence of 50% (P = 0.5). Although the sample size calculation indicated that a larger number of participants would be required to achieve the desired statistical power, the actual number of participants included in this study was lower due to practical constraints such as time, laboratory facilities for hemoglobin measurement, and participant availability. BMI was calculated by the formula, BMI= Weight (kg)/Height2 (m) [18].
2.6. Estimation of Hemoglobin and Iron in Blood Serum
Five (5) ml of venous blood was also collected from each student for clinical analysis and divided into two tubes, and 2 ml was drawn into K3EDTA tubes to measure hematological parameters, whereas 3 ml was drawn into a plain tube with no anticoagulant to measure serum iron (SI).
Hemoglobin was estimated by the cyanmethemoglobin method, where 20 µL of EDTA blood was mixed with 5 mL of reagent kit to convert hemoglobin to a stable cyanmethemoglobin complex. After 5–10 minutes at room temperature, absorbance was measured at 540 nm against a reagent blank, and hemoglobin concentration was calculated using a standard solution.
Serum iron was estimated by the ferrozine colorimetric method reported elsewhere. Blood samples were collected without anticoagulant, allowed to clot, and centrifuged at 3000 rpm for 15 minutes to obtain serum. In this method, ferric iron in serum is released by acidic treatment and reduced to the ferrous state, which then reacts with ferrozine to form a colored complex. The intensity of the color, measured at 562 nm against a reagent blank, is directly proportional to the iron concentration and calculated using a standard solution. Clinical chemistry analyzer (Model EA 200) has been used for serum iron and hemoglobin estimation.
2.7. Statistical Analysis
All statistical analyses were performed using IBM SPSS Statistics (version XX, IBM Corp., Armonk, NY, USA). Descriptive statistics, including frequencies, percentages, and means, were used to summarize participants’ demographic characteristics and survey responses. The chi-square (χ²) test was applied to examine associations between categorical variables. A p-value of less than 0.05 was considered statistically significant.
3.1. Socio-demographic Characteristics and Food Habits of the Participants
Table 1 presents the demographic, socioeconomic, BMI, and dietary characteristics of the study participants (N = 230). Of the participants,140 (60.9%) were female and 90 (39.1%) were male. The mean values with standard deviations (Mean ± SD) for age, height, weight, and BMI of the study participants were 21.63 ± 1.56 years, 1.61 ± 0.08 m, 61.29 ± 12.4 kg, and 23.60 ± 4.07 kg/m², respectively.
Table 1. Socio-demographic characteristics, BMI, and food habits of the study population (N=230).
| Category | Variables | Sub-Category | Frequency (n) | Percent (%) |
| Demographics | Gender | Male | 90 | 39.1 |
| Female | 140 | 60.9 | ||
| Age Group (Years) | Male: 19–27 | 90 | 39.1 | |
| Female:18–25 | 140 | 60.9 | ||
Educational Level (in Bachelor) | 1st Year | 82 | 35.7 | |
| 2nd Year | 82 | 35.7 | ||
| 3rd Year | 40 | 17.4 | ||
| 4th Year | 26 | 11.3 | ||
| Socio-economic Status | Income Level | Low (<15K) | 17 | 7.4 |
Medium (16K–30K) | 103 | 44.8 | ||
Upper Medium (31K–50K) | 93 | 40.4 | ||
| High (>50K) | 17 | 7.4 | ||
| BMI Characteristics | BMI Category | Underweight (≤18.4) | 20 | 8.7 |
Normal (18.5–24.9) | 126 | 54.8 | ||
Overweight (25–29.9) | 72 | 31.3 | ||
| Obese (≥30) | 12 | 5.2 | ||
| Food Habits | Breakfast Consumption Pattern | Skip | 29 | 12.6 |
| Regular | 103 | 44.8 | ||
| Irregular | 98 | 42.6 | ||
| Lunch Consumption Pattern | Skip | 5 | 2.2 | |
| Regular | 167 | 72.6 | ||
| Irregular | 58 | 25.2 | ||
| Dinner Consumption Pattern | Skip | 9 | 3.9 | |
| Regular | 186 | 80.9 | ||
| Irregular | 35 | 15.2 |
In terms of educational level, 35.7% of respondents were found in both the 1st and 2nd years of an honors program. A smaller percentage (17.4%) were in their 3rd year, and an even smaller percentage (11.3%) were in their 4th year. Regarding socio-economic status, 7.4% of the participants belonged to the low-income group (<15K), 44.8% were in the medium-income group (16K–30K), 40.4% fell into the upper-medium-income category (31K–50K), and another 7.4% were in the high-income group (>50K). For BMI classification, 8.7% of respondents were underweight (≤18.4), 54.8% had normal weight (18.5–24.9), 31.3% were overweight (25–29.9), and 5.2% were obese (≥30). Their food-consuming patterns were also analyzed. Analyzing the breakfast habit, we found 12.6% of the participants skipped breakfast. 44.8% of the participants eat breakfast regularly, and 42.6% of the participants are irregular in taking breakfast. The vast majority, 72.6%, consume lunch daily. 25.2% are irregular in having lunch. Only 2.17% of respondents skip lunch. The dinner consumption patterns show that 80.9% of participants eat dinner regularly, with only 3.9% skipping dinner. However, 15.2% of the participants have an irregular dinner consumption pattern (Table 1).
3.2. Estimation of Hemoglobin of the Participants
Table 2 showed the data of hemoglobin and serum iron level of the participants. 48.6% of total female participants had hemoglobin levels below 12 g/dl, indicating that nearly half of the students fall into this category. Another 28.6 had hemoglobin levels in the range of 12–13 g/dl. The remaining 22.9% had hemoglobin levels greater than 13 g/dl. 65.6% of total male participants have hemoglobin levels below 13 g/dl, representing the majority of the group.
Table 2. The estimated hemoglobin and serum iron level of the participants (N=230).
| Hemoglobin Level (gm/dl) | Gender | Range | Frequency | Percent |
| Female (N=140) | <12 | 68 | 48.6 | |
| 12-13 | 40 | 28.6 | ||
| >13 | 32 | 22.9 | ||
| Male (N=90) | <13 | 59 | 65.6 | |
| 13-14 | 9 | 10.0 | ||
| >14 | 22 | 24.4 | ||
| Serum Iron Level (micromole/L) | Female (N=140) | <11 | 60 | 42.9 |
| 11-25 | 63 | 45.0 | ||
| >25 | 17 | 12.1 | ||
| Male (N=90) | <13 | 24 | 26.7 | |
| 13-27 | 53 | 58.9 | ||
| >27 | 13 | 14.4 |
An additionally 10% have hemoglobin levels between 13 and 14 g/dl. 24.4% have hemoglobin levels greater than 13 g/dl. 45% of the female respondents had the serum iron level in 11-25 micromole/L range. An almost similarly large group which is 42.9% had values less than 11 micromoles/L, which is also nearly half of the sample. A smaller proportion (12.1%) of participants had values greater than 25 micromole/L. The majority of male participants which is 58.9%, have serum iron levels between 13-27 micromole/L. 26.7% have serum iron levels less than 13 micromoles/L, indicating that this group might be at risk for iron deficiency. A smaller percentage (14.4%) have serum iron levels greater than 27 micromoles/L.
3.3. Association of Level of Hemoglobin with Food Habits and Mental Health
The association of various parameters of mental health (sleeping problems, depression symptoms, stress, and fatigue) and food habits (vegetable intake and fruit intake) to hemoglobin level in female (140) and male (90) participants along with the corresponding p-values for statistical significance is shown in Table 3. Hemoglobin levels were categorized for females as <12 g/dl, 12-13 g/dl, and >13 g/dl, and for males as <13 g/dl, 13-14 g/dl, and >13 g/dl. In the case of 140 female participants, 31 participants had sleeping problems compared to 37 without sleeping problems with Hb <12 g/dl (p=0.648).
Table 3. Association of various parameters of mental health and food habits to hemoglobin level in female and male students (N=230).
| Category | Variables | Hemoglobin level of female students (N=140) | Total N/ (%) | P- value | |||
| <12g/dl | 12-13g/dl | >13/dl | |||||
Female: Mental health status | Sleeping problem | Yes | 31 | 15 | 15 | 61 (43.6) | 0.648 |
| No | 37 | 25 | 17 | 79 (56.4) | |||
Depression symptoms | No | 38 | 15 | 15 | 68 (48.6) | 0.302 | |
| Moderate | 24 | 23 | 15 | 62 (44.3) | |||
| Severe | 6 | 5 | 7 | 18 (12.9) | |||
| Stress | Yes | 40 | 26 | 20 | 86 (61.4) | 0.808 | |
| No | 28 | 14 | 12 | 54 (38.6) | |||
| Fatigue | Yes | 29 | 23 | 17 | 69 (49.3) | 0.291 | |
| Female: Diet habits | No | 39 | 17 | 15 | 71 (50.7) | ||
| Vegetable intake | Low | 9 | 9 | 9 | 27 (19.3) | 0.114 | |
| Medium | 50 | 26 | 15 | 91 (65) | |||
| High | 9 | 5 | 8 | 22 (15.7) | |||
| Fruits Intake | Low | 18 | 11 | 20 | 49 (35) | 0.03 | |
| Medium | 46 | 26 | 9 | 81 (57.9) | |||
| High | 5 | 5 | 0 | 10 (7.1) | |||
| Hemoglobin level of male students (N=90) | |||||||
| <13 | 13-14 | >13 | |||||
Male: Mental health status | Sleeping problem | Yes | 13 | 6 | 6 | 25 (6.7) | 0.725 |
| No | 43 | 6 | 16 | 65 (72.2) | |||
Depression symptoms | No | 34 | 5 | 10 | 49 (54.4) | p < 0.05 | |
| Moderate | 23 | 6 | 7 | 36 (40) | |||
| Severe | 0 | 0 | 5 | 5 (5.6) | |||
| Stress | Yes | 25 | 9 | 12 | 46 (51.1) | 0.876 | |
| No | 29 | 5 | 10 | 44 (48.9) | |||
| Fatigue | Yes | 19 | 6 | 6 | 31 (34.4) | 0.104 | |
| No | 40 | 3 | 16 | 59 (65.6) | |||
| Male: Diet habits | Vegetable intake | Low | 18 | 0 | 5 | 23 (26.5 | 0.612 |
| Medium | 30 | 5 | 14 | 49 (54.4) | |||
| High | 12 | 0 | 6 | 18 (20) | |||
| Fruits Intake | Low | 29 | 5 | 8 | 42 (46.7) | p < 0.05 | |
| Medium | 24 | 0 | 14 | 38 (42) | |||
| High | 5 | 0 | 5 | 10 (11) | |||
In the case of female students, hemoglobin levels showed no statistically significant association with sleeping problems, depressive symptoms, stress, fatigue, or vegetable intake. Of the 140 participants, 61 (43.6%) reported sleeping problems, yet hemoglobin distributions did not differ significantly between those with and without sleep disturbances (p = 0.648). Similarly, depressive symptoms, classified as none (n = 68), moderate (n = 62), and severe (n = 18), showed no significant association with hemoglobin levels (p = 0.302). Stress was reported by 61.4% of females and fatigue by 49.3%, but neither variable demonstrated a meaningful relationship with hemoglobin status (p = 0.808 and p = 0.291, respectively). Dietary habits were also examined: vegetable intake was categorized as low (n = 27), medium (n = 91), and high (n = 22). Among participants with low intake, hemoglobin levels were distributed as 9, 9, and 9 in the <12 g/dl, 12–13 g/dl, and >13 g/dl groups, respectively. For medium intake, the corresponding distribution was 50, 26, and 15, and for high intake, 9, 5, and 8. No significant association was found (p = 0.114). Vegetable intake did not show a significant association with hemoglobin (p = 0.114). In contrast, fruit intake was low in 49 participants, medium in 81, and high in 10. Hemoglobin levels were distributed as 18, 11, and 20 among those with low fruit intake; 46, 26, and 9 among those with medium intake; and 5, 5, and 0 among those with high intake. It revealed a statistically significant relationship (p = 0.03).
In the case of male participants, 13 participants reported sleeping problems, while 43 participants did not (p = 0.725) with hemoglobin <13 g/dL. 34 participants reported no depression, while 23 reported moderate depression. None had severe depression in this group. Depression showed a statistically significant relationship with hemoglobin <13 g/dL (p < 0.05). A total of 25 participants with hemoglobin <13 g/dL reported stress, whereas 29 did not (p = 0.876). 19 participants experienced fatigue compared to 40 who did not (p = 0.104). 18 participants reported low vegetable intake, 30 reported medium intake, and 12 reported high intakes with hemoglobin <13 g/dL (p = 0.612). Low fruit intake was reported by 29 male participants with hemoglobin <13 g/dL, compared to 24 with medium intake and 5 with high intake (p < 0.05).
3.4. Evaluation of Knowledge level of Participants about IDA
The present study assessed participants' knowledge regarding anemia across several domains (Table 4). Among 230 respondents, 57.8% demonstrated awareness of the causes of anemia, with a statistically significant association (p = 0.007).
Table 4. Knowledge regarding anemia among study participants (N = 230).
| Knowledge Item | Yes, n (%) | No, n (%) | Total | p-value |
| Causes of IDA | 133 (57.8) | 97 (42.2) | 230 | 0.007 |
| Symptoms of IDA | 127 (55.2) | 103 (44.8) | 230 | 0.017 |
| Knowledge about iron-rich foods | 157 (68.3) | 73 (31.7) | 230 | 0.001 |
| Foods that help in iron absorption | 134 (58.3) | 96 (41.7) | 230 | 0.040 |
| Beverages that decrease iron absorption | 109 (47.4) | 121 (52.6) | 230 | 0.214 |
Similarly, 58.3% of participants recognized the role of certain foods in enhancing iron absorption, with statistical significance (p = 0.04). In contrast, only 47.4% were aware that certain beverages can inhibit iron absorption, and this finding was not statistically significant (p = 0.214).
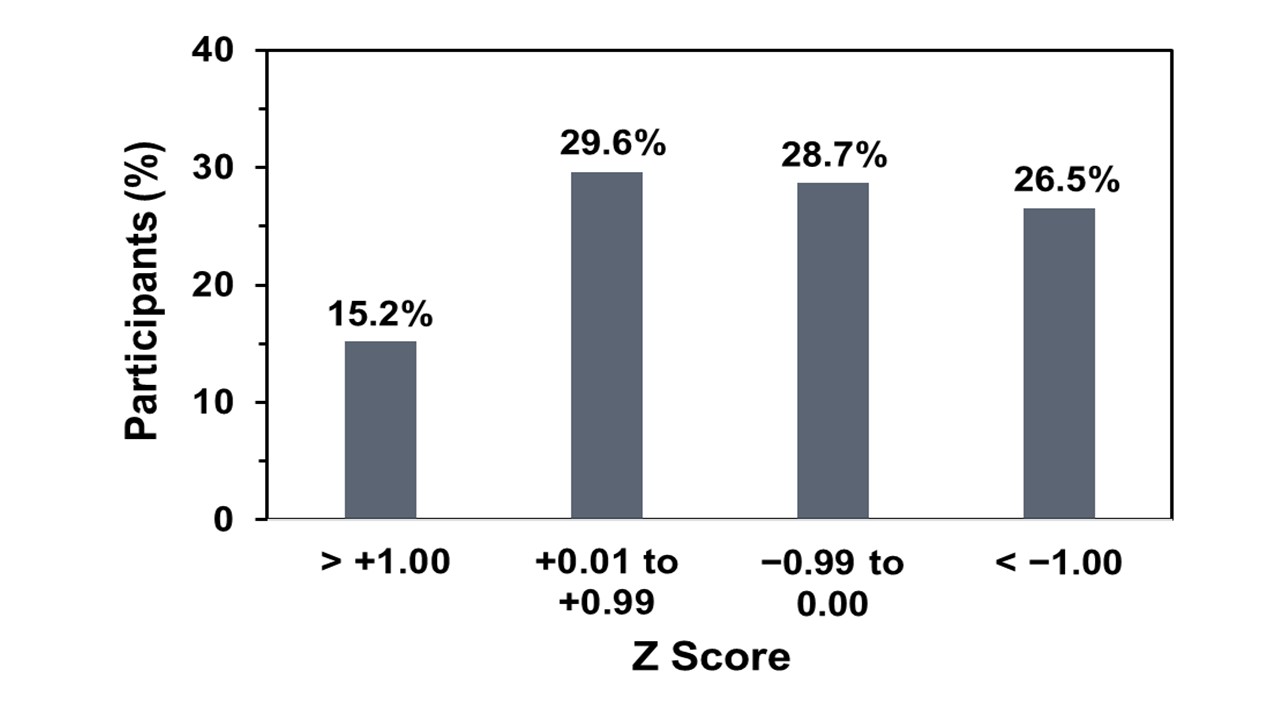
Figure 1. Distribution of participants according to Z-score regarding knowledge about anemia (N = 230).
Based on Z-score categorization in Figure 1, 15.2% of students demonstrated excellent knowledge (Z > +1.00), 29.6% had good knowledge (+0.01 to +0.99), 28.7% showed average knowledge (−0.99 to 0.00), and 26.5% were in the poor knowledge category (Z < −1.00). Overall, the findings indicate that a considerable percentage of participants have limited knowledge regarding the causes, symptoms, and dietary sources related to anemia. These findings are consistent with the responses presented in Table 4, where a relatively higher proportion of participants correctly identified iron-rich foods (68.3%) and foods aiding iron absorption (58.3%), compared with lower recognition of anemia causes (57.8%) and symptoms (55.2%). Notably, knowledge regarding beverages that inhibit iron absorption was weakest (47.4%), which may explain why a quarter of students scored poorly in the Z-score classification.
Iron deficiency anemia (IDA) remains a pervasive public health issue globally, affecting approximately 24.8% of the population, with higher prevalence among adolescent girls and young women due to inadequate dietary iron intake, poor absorption, and increased physiological demands during reproductive years [19-21]. The present study revealed a high prevalence of anemia among university students in Bangladesh, with 48.6% of females and 65.6% of males exhibiting hemoglobin levels below the normal range. These rates are higher than those reported in some regional studies, such as 12.5% IDA among female students at the University of Tabuk in Saudi Arabia [22] and 15.6% anemia among students in Yemen [23].
However, findings of this study are aligned with higher figures from other investigations, including 67.35% hemoglobin deficiency in female Indian students and 32.0% IDA among Indian medical students (44.0% in females) [24]. Similarly, prevalence rates of 40.9% in Iran, 29.0% in the UAE [25], and 43.1% in Pakistan (30.4% in females) [26] underscore that IDA is not confined to low-resource settings but also is exacerbated by lifestyle factors in educated populations. In this study, the unexpectedly higher anemia rate in males (65.6%) contrasts with typical gender patterns [19, 20, 25, 26], possibly attributable to irregular meal patterns, reliance on dormitory food lacking nutritional balance [15], and consumption of calorie-dense but nutrient-poor junk foods like fried items and sweetened beverages [17], as observed in participants.
Socioeconomic and dietary factors played a significant role in our findings. Participants from diverse income levels showed irregular meal consumption, with 42.6% irregular in breakfast, 25.2% in lunch, and 15.2% in dinner, echoing studies linking poor time management, financial constraints, and unhealthy eating habits to nutritional deficiencies [16, 27]. A notable association was found between hemoglobin levels and fruit intake in both genders (p = 0.03 for females; p = 0.01 for males), consistent with evidence that regular fruit and vegetable consumption enhances iron absorption and mitigates anemia risk, particularly in young women [28, 29]. However, no significant link was observed with vegetable intake (p > 0.05), possibly due to overall low-to-medium intake levels or co-consumption with iron inhibitors like tea and coffee [30]. BMI distribution revealed 31.3% overweight and 5.2% obese participants, aligning with research associating obesity with increased anemia risk in adolescents through inflammatory mechanisms [31]. These dietary patterns, combined with high junk food intake [17], likely contributed to the observed micronutrient gaps.
The study also highlighted associations between IDA and mental health. Many participants reported sleeping problems (43.6% females, 27.8% males), depression symptoms (57.2% females with moderate/severe, 45.6% males), stress (61.4% females, 51.1% males), and fatigue (49.3% females, 34.4% males). A significant link emerged between hemoglobin levels and depression in males (p < 0.001), supporting literature on iron's role in neurodevelopmental and mood disorders, including increased risks of depression, anxiety, and sleep disturbances [32, 33]. Although no substantial relations were found in females for mental health parameters (p > 0.05), the high prevalence of symptoms suggests indirect influences, as IDA can impair cognitive function and socioemotional well-being across life stages [33, 35]. Iron supplementation has been shown to ameliorate these effects independently of hemoglobin levels [33–35], emphasizing the need for interventions.
Knowledge gaps were evident, with only 57.8% aware of anemia causes, 55.2% of symptoms, and 47.4% of absorption inhibitors (p = 0.214 for the latter, indicating non-significance). While 68.3% knew iron-rich foods (p = 0.001), Z-score analysis showed 26.5% with poor knowledge and only 15.2% excellent, consistent with prior findings of low awareness among students despite education [15, 36]. These gaps may perpetuate poor habits, as seen in associations between low nutrient intake and anemia [37]. Furthermore, the quality and safety of iron-rich foods like meat may be compromised by antibiotic-resistant bacterial contamination, as reported in local meat shops, potentially reducing their consumption due to health concerns or leading to infections that impair nutrient absorption [38].
Overall, our results indicate that university students are vulnerable to IDA due to suboptimal diets and mental health stressors. These findings are aligned with global patterns [2, 3, 21] and highlight the need for targeted nutrition education, promotion of iron-rich diets, and mental health support to reduce prevalence and improve well-being [36].
Limitations include the convenience sampling and smaller-than-ideal sample size due to logistical constraints, which may limit generalizability. Future studies should incorporate longitudinal designs and biomarkers like ferritin for deeper insights.
This study revealed a significant prevalence of iron deficiency anemia (IDA) with 48.6% of females and 65.6% of males, alongside iron deficiency rates of 42.9% and 26.7%, respectively among university students. Despite their educational background, participants exhibited notable knowledge gaps regarding anemia causes, symptoms, and dietary factors affecting iron absorption, with only 15.2% demonstrating excellent knowledge. Irregular meal patterns, dependence on nutrient-poor foods, and mental health challenges, including depression, stress, and sleep disturbances, were prevalent. Association of hemoglobin levels, food habits particularly fruit intake (p < 0.05 for both genders) and depression in males (p < 0.001) reported here. These findings underscore the prerequisite for targeted interventions, including nutrition education programs to promote iron-rich diets and awareness of absorption inhibitors, as well as mental health support to address stress and depression. Implementing such measures could enhance students’ nutritional status, reduce IDA prevalence, and improve overall health and academic performance in this population.
The authors gratefully acknowledge the Department of Biochemistry and Molecular Biology for providing laboratory facilities and Centre for Multidisciplinary Research, Gono Bishwabidyalay to support and encourage to carry out this study.
The project was mainly funded by the Department of Biochemistry and Molecular Biology, with the remaining support provided through self-funding by the authors.
The authors declare that they don’t have any kind of conflict of interest.
This study was approved by the Center for Multidisciplinary Research, Ethical Clearance. Memo No: CMR/EC/026, Gono Bishwabidyalay. The information and identity of the participants was kept private. All the patients included in this study were informed about the study. Participation in this research was fully voluntary. The respondents had remained entirely free to withdraw their participation at any stage or any time of the study. Informed written consent was taken from each patient.

This work is licensed under a
Creative Commons Attribution 4.0 International License
.
You are free to share and adapt this material for any purpose, even commercially, as long as you give appropriate credit.
 access