J. Biosci. Public Health. 2025; 1(2)
Coauthor
![]() https://orcid.org/0009-0002-3073-7524
https://orcid.org/0009-0002-3073-7524
Affiliations:
Department of Biochemistry and Molecular Biology, University of Rajshahi, Rajshahi-6205, Bangladesh.
Corresponding Author *
![]() https://orcid.org/0000-0002-4831-0863
https://orcid.org/0000-0002-4831-0863
Affiliations:
Quality Control Laboratory, Department of Fisheries (Ministry of Fisheries and Livestock), C&B Moor, Anwar Jang Road, Savar1343, Dhaka, Bangladesh.
Corresponding Author *
![]() https://orcid.org/0000-0002-4831-0863
https://orcid.org/0000-0002-4831-0863
Affiliations:
Quality Control Laboratory, Department of Fisheries (Ministry of Fisheries and Livestock), C&B Moor, Anwar Jang Road, Savar1343, Dhaka, Bangladesh.
This cross-sectional study investigated vitamin D level and knowledge among 235 participants, examining the influence of occupational and demographic factors. Data were collected on estimated vitamin D levels from clinical diagnostic reports, sociodemographic characteristics, sunlight exposure, and knowledge about vitamin D. Results revealed significant gender-based differences in vitamin D levels, with females exhibiting a higher prevalence of deficiency (56.9%) compared to males (50.7%), whereas males exhibited higher mean levels than females across age groups, particularly in the 36–45 and 46–55 age ranges (p < 0.05). Outdoor workers had the highest vitamin D levels (males: 43.02 ± 14.81 ng/mL; females: 36.84 ± 11.28 ng/mL), while indoor workers had the lowest (males: 18.06 ± 5.43 ng/mL; females: 14.35 ± 4.67 ng/mL). Sunlight exposure positively correlated with vitamin D levels, with significant differences for exposure durations of 30–180 minutes (p < 0.05). Knowledge about vitamin D was higher among students (68.4%) and those with higher education (85.2% among graduates), while it was lower among homemakers (25.7%) and those with no education (38.5%). These findings underscore the impact of occupation, sunlight exposure, and education on vitamin D status and knowledge, highlighting the need for targeted interventions to address deficiencies.
Vitamin D, a fat-soluble vitamin, is essential for maintaining calcium homeostasis, promoting bone health, and supporting immune function [1]. It is primarily synthesized in the skin through exposure to ultraviolet B (UVB) radiation, with dietary sources and supplementation playing a secondary role [2]. Vitamin D deficiency, defined as serum 25-hydroxyvitamin D [25(OH)D] levels below 12 ng/mL, is a global public health concern, linked to conditions such as osteoporosis, rickets, cardiovascular diseases, and increased susceptibility to infections [3, 4]. Insufficiency (12–19 ng/mL) and sufficiency (20–50 ng/mL) are critical thresholds for assessing health risks [5]. From 2000, vitamin D deficiency remained a global public health concern, particularly in regions with limited sunlight exposure, highly urbanized environments, or cultural practices that restrict skin exposure to UVB rays [6]. The prevalence was notably higher during the winter and spring seasons compared to summer and autumn. Higher deficiency rates were also observed in the Eastern Mediterranean region and among lower-middle-income countries. Females were disproportionately affected. This widespread deficiency contributes significantly to the global burden of disease [7].
Occupational patterns significantly influence vitamin D status due to variations in sunlight exposure. Outdoor workers, such as laborers, benefit from prolonged UVB exposure, resulting in higher serum vitamin D levels compared to indoor workers, such as office employees, who are at greater risk of deficiency [8, 9]. Demographic factors, including age, gender, and education, further contribute to vitamin D levels and knowledge. For example, females often exhibit lower vitamin D levels due to cultural practices, such as covering the body using clothes or applying sunscreen, that limit sun exposure or due to physiological differences in skin pigmentation and fat distribution [10, 11]. Educational attainment also plays a crucial role in shaping knowledge, awareness about vitamin D, influencing supplementation practices, and lifestyle choices [12, 13]. Studies have shown that individuals with higher education levels are more likely to understand the importance of vitamin D and adopt preventive measures against deficiency [14].
In Bangladesh, where sunlight is abundant, however, urbanization and indoor lifestyles are also increasing. A study found that 62.1% of the population in Bangladesh possessed vitamin D levels below 20 ng/mL, which is a sign of a widespread deficiency. There was a clear gender difference, with women making up 74.7% of those who were deficient and men making up 25.3% [15]. Therefore, vitamin D deficiency remains a significant public health issue, particularly among specific demographic and occupational groups of people [16]. Despite growing global evidence, few studies have explored the interplay between occupation, sunlight exposure, and vitamin D knowledge in diverse populations within this region. Although previous studies in South Asia have identified socio-demographic determinants such as age and gender as influential factors in vitamin D status [17, 18], limited reports exist on how occupational categories and knowledge levels contribute to this health issue. Moreover, most existing research has been concentrated in urban settings, leaving a significant knowledge gap in semi-urban or peri-urban populations. This study aims to address these gaps by evaluating vitamin D status and knowledge across different occupational groups, ages, genders, and educational levels among a cohort of 235 individuals residing outside Dhaka, Bangladesh. Understanding these associations is critical for identifying vulnerable populations and designing context-specific public health strategies to reduce the burden of vitamin D deficiency.
Therefore, the objective of this study was to assess serum vitamin D levels and knowledge regarding its importance among individuals from diverse occupational and age groups. Additionally, the study examined correlations between socio-demographic factors (age, gender, and occupation) and daily outdoor activities-specifically sunlight exposure-with vitamin D status. This comprehensive approach aims to understand population-specific risk factors and guide future public health interventions in similar settings.
2.1 Study Design and Population
This mixed-method, cross-sectional study was conducted from January 2024 to April 2025 among 235 participants who sought health services or follow-up treatment at a specialized hospital outside of Dhaka (Gazipur), Bangladesh. The study design facilitated the collection of clinical data on vitamin D levels from diagnostic reports, alongside socio-demographic characteristics and lifestyle information (daily sunlight exposure) gathered through structured interviews conducted in person or over the telephone. Knowledge levels related to vitamin D were assessed using a scoring system based on five structured questions.
2.2 Inclusion and Exclusion Criteria
Inclusion criteria encompassed individuals diagnosed with vitamin D deficiency who were willing to participate in the study. Exclusion criteria included individuals who refused participation, those with a history of malnutrition-associated diseases, or those already taking vitamin D supplements, to avoid confounding factors.
2.3 Knowledge Level Scoring System
A scoring system was developed to assess respondents' knowledge levels related to vitamin D and calcium. All participants were asked to respond to five structured questions, with a total possible knowledge score of 5. The questions were as follows: (i) Vitamins and minerals are essential for health; (ii) Vitamin D is essential for human health; (iii) Sunlight produces vitamin D in our body; (iv) Familiar with the term "osteoporosis," and (v) One vitamin D-containing food name. The correct answer score is 1, and incorrect answers receive a ‘0’ score. The score obtained by a participant between 3 and 5 means “good knowledge,” while a score below 3 (≤3) means “poor knowledge.”
2.4 Sample Size Calculation
The total number of participants of this study was 235. The sample size was calculated using the following equation [19]:
 |
Here, n = number of samples
z = 1.96 (95% confidence level)
q = (1-p)
d = margin of error or precision (10% of 0.05)
p= estimated proportion of the population (50% or 0.5)
[If the total sample size is fixed i.e. n = 235, keeping Z=1.96Z = 1.96Z=1.96, d=0.05d = 0.05d=0.05, then p will be 0.39 to justify this sample size].
Therefore, assuming an estimated proportion of the outcome of interest as p = 0.39, the calculation is:
Thus, the final sample size was determined to be 235 participants.
2.5 Data Collection
Data were collected using a random sampling technique to ensure representativeness and reduce selection bias. A pilot test of the data collection tools was conducted to identify and address issues such as ambiguous questions or technical problems. Clinical data on vitamin D levels were obtained from diagnostic reports, while sociodemographic and lifestyle data were collected through structured interviews. For the quantitative determination of 25-OH vitamin D in human serum, the sandwich chemiluminescence immunoassay method and the MAGLUMI series fully automated chemiluminescence immunoassay analyzer with the Biolumi series integrated system were used. In addition, cutoffs value of Vitamin D was considered as: Deficiency: <20 ng/mL, Insufficiency: 20–29 ng/mL, Sufficiency/Normal: 30–100 ng/mL: Potential toxicity >100 ng/mL. Knowledge levels were assessed using the scoring system described above.
2.6 Statistical Analysis
Data analysis for this study was conducted using Microsoft Excel 2019 and IBM SPSS Statistics, Version 25.0 (Chicago, IL, USA). Microsoft Excel was utilized for data cleaning, editing, sorting, and coding. Subsequently, the Excel file was imported into SPSS software. Descriptive statistics, such as frequencies, percentages, means, and standard deviations, were calculated. Chi-square tests were utilized to evaluate relationships between sociodemographic factors and knowledge levels, with a significance level set at p < 0.05 and a confidence interval of 95%.
3.1 Socio-Demographic Characteristics
Table 1 provides an overview of the socio-demographic characteristics of the 235 participants. The majority were female (68.1%, n=160), with males comprising 31.9% (n=75). Age distribution showed that 20.9% (n=49) were aged 46–55 years, followed by 17.0% (n=40) aged 36–45 years. Professionally, 34.0% (n=80) were indoor workers, 31.6% (n=74) were homemakers, and 17.0% (n=40) were outdoor workers. Educational attainment varied across participants: 5.5% had no formal education, while the majority had completed secondary (24.7%), higher secondary (28.5%), or graduate-level education (26.0%).
Table 1. The socio-demographic characteristics of the respondents (N=235).
| Characteristics | Variables | Frequency (n) | Percentage (%) |
| Gender | Female | 160 | 68.1% |
| Male | 75 | 31.9% | |
| Age (yrs.) | <18 | 28 | 11.9% |
| 18–25 | 21 | 8.9% | |
| 26–35 | 26 | 11.1% | |
| 36–45 | 40 | 17.0% | |
| 46–55 | 49 | 20.9% | |
| >55 | 32 | 13.6% | |
| Profession | Students | 19 | 8.0% |
| Indoor Job | 80 | 34.0% | |
| Mixed Indoor-Outdoor | 22 | 9.4% | |
| Homemakers | 74 | 31.6% | |
| Outdoor Workers/Laborers | 40 | 17.0% | |
| Educational Level | No Education | 13 | 5.5% |
| Primary | 36 | 15.3% | |
| Secondary | 58 | 24.7% | |
| Higher Secondary | 67 | 28.5% | |
| Graduate | 61 | 26.0% |
3.2 Vitamin D Levels by Gender and Age
The data presented in Figure 1 reveal significant gender-based disparities in vitamin D status among participants, with females exhibiting a higher prevalence of deficiency (56.9%) compared to males (50.7%). While insufficiency (20-29 ng/mL) was similarly distributed between genders (~24%), sufficiency (≥30 ng/mL) was slightly more common in males (24.0% vs. 18.8%), reflecting occupational advantages in outdoor sunlight exposure. Notably, only one case of potential toxicity (>100 ng/mL) was observed in each gender, confirming the rarity of hypervitaminosis D without supplementation.
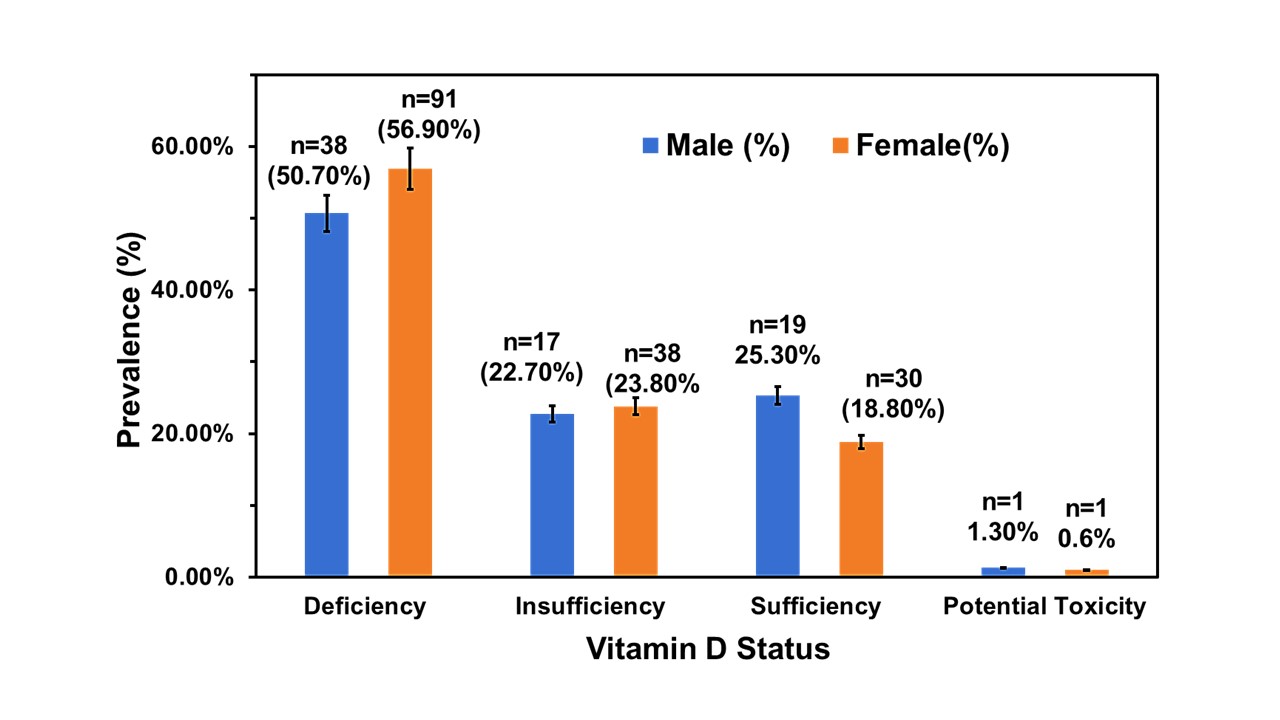
Figure 1. The gender specific status of Vitamin D level of the participants (N=235). Here, Deficiency: <20 ng/mL, Insufficiency: 20–29 ng/mL, Sufficiency:30–100 ng/mL: Potential toxicity >100 ng/mL.
The age-standardized distribution and average serum vitamin D levels among male and female participants, along with the results of independent t-tests comparing means between sexes across age groups, are shown in Table 2. Males with middle age had higher mean vitamin D levels than females, whereas younger and older females exhibited relatively higher mean values. Among males, the highest average vitamin D level was observed in the 36–45 years age group (28.59 ± 17.12 ng/mL), followed by the 46–55 years group (26.17 ± 15.62 ng/mL). In contrast, female participants in the 26–35 years group showed the highest average level (22.56 ± 8.12 ng/mL), although with a wider range (6.23–44.68 ng/mL). Statistical comparison between male and female revealed significant differences in several age groups. Males had significantly higher vitamin D levels in the 36–45 years (t = 2.12, p = 0.031) group. However, females had higher mean values in the <18 years (p = 0.053) and 26–35 years (p = 0.066) categories, though the differences were less pronounced. No significant differences were observed in the >55 years age group (p = 0.561).
Table 2. Age-standardized distribution and estimated mean levels of serum Vitamin D among study participants.
| Age (Yrs) | Male (n=75) | Female (n=160) | Statistical Analysis | |||
Freq. (%) | Mean (ng/mL) | Freq. (%) | Mean (ng/mL) | t-value | p-value | |
| <18 | 8 (10.7%) | 21.68 ± 5.32 | 20 (12.5%) | 22.12 ± 10.85 | -0.15 | 0.053 |
| 18–25 | 9 (12.0%) | 17.69 ± 9.45 | 12 (7.5%) | 18.87 ± 4.78 | -0.42 | 0.767 |
| 26–35 | 8 (10.7%) | 20.05 ± 8.21 | 18 (11.3%) | 22.56 ± 8.12 | 0.16 | 0.066 |
| 36–45 | 14 (18.7%) | 28.59 ± 17.12 | 26 (16.3%) | 19.23 ± 6.45 | 2.12 | 0.031 |
| 46–55 | 12 (16.0%) | 25.17 ± 15.62 | 37 (23.1%) | 21.94 ± 8.01 | 1.20 | 0.238 |
| >55 | 11 (14.7%) | 22.36 ± 4.47 | 21 (13.1%) | 20.71 ± 9.87 | 0.59 | 0.561 |
3.3 Vitamin D Levels by Sunlight Exposure
Table 3 illustrates the comparison of mean serum vitamin D levels between male and female participants based on their reported daily sunlight exposure durations. Independent t-test analyses showed statistically significant sex-based differences in vitamin D levels for all exposure durations of ≥30 minutes. An increasing trend in mean vitamin D levels was observed with longer sunlight exposure durations of 30–60 minutes (p=0.034), 60–120 minutes (p=0.022), 120–180 minutes (p=0.006), and >180 minutes (p=0.008), with males consistently showing higher mean levels than females. However, females had a greater proportion of limited sunlight exposure (<30 minutes: 50.6%) compared to males (22.7%). Moreover, individuals with daily sun exposure of two hours or more were found to have sufficient levels of vitamin D (i.e. >30 ng/mL).
Table 3. Comparison of mean serum Vitamin D levels between male and female participants based on their daily sunlight exposure duration.
| Exposure Time (min) | Male (N=75) | Female (N=160) | Statistical Values | |||
Freq. (%) | Mean (ng/mL) | Freq. (%) | Mean ( ng/mL) | t-value | p-value | |
| <30 | 17 (22.7%) | 21.81 ± 6.59 | 81 (50.6%) | 20.59 ± 10.53 | 0.62 | 0.037 |
| 30–60 | 27 (36.0%) | 25.68 ± 7.62 | 33 (20.6%) | 24.87 ± 6.74 | 2.15 | 0.034 |
| 60–120 | 15 (20.0%) | 27.67 ± 11.24 | 24 (15.0%) | 28.61 ± 9.18 | 2.33 | 0.022 |
| 120–180 | 11 (14.7%) | 33.89 ± 21.36 | 15 (9.4%) | 30.32 ± 6.87 | 2.79 | 0.006 |
| >180 | 5 (6.7%) | 40.82 ± 14.81 | 7 (4.4%) | 38.57 ± 6.55 | 2.71 | 0.008 |
3.4 Vitamin D Levels by Profession
Table 4 presents the results of independent t-tests comparing mean vitamin D levels between males and females across different occupations. Among students, males had a higher mean vitamin D level (26.81 ± 9.78 ng/mL) compared to females (24.37 ± 6.74 ng/mL), and this difference was statistically significant (t = 1.92, p = 0.029). Indoor workers showed significantly lower vitamin D levels in both sexes, with males averaging 18.06 ± 5.43 ng/mL and females 14.35 ± 4.67 ng/mL; the difference was highly significant (t = 3.42, p = 0.001). In the mixed indoor–outdoor group, males exhibited a higher mean level (31.26 ± 9.07 ng/mL) than females (27.21 ± 7.11 ng/mL), with a statistically significant difference (p = 0.001). Notably, the homemaker category consisted entirely of females (46.3%, n = 74), with an average vitamin D level of 18.87 ± 6.35 ng/mL (deficient in vitamin D); no male participants were included in this group. Among outdoor workers, the highest mean vitamin D levels (sufficient) were observed for both sexes, with males averaging 43.02 ± 14.81 ng/mL and females 36.84 ± 11.28 ng/mL. The gender difference in this group was statistically significant (t = 3.14, p = 0.003). Overall results show profession- and gender-based variations in vitamin D levels.
Table 4. Mean serum Vitamin D levels among male and female participants and their correlation with occupational categories.
| Profession | Male (N=75) | Female (N=160) | Statistical Values | |||
Freq. (%) | Mean (ng/mL) | Freq. (%) | Mean (ng/mL) | t-value | p-value | |
| Students | 6 (8.0%) | 26.81 ± 9.78 | 13 (6.9%) | 24.37 ± 6.74 | 1.92 | 0.029 |
| Indoor Workers | 29 (38.7%) | 18.06 ± 5.43 | 51 (31.9%) | 14.35 ± 4.67 | 3.42 | 0.001 |
| Mixed Indoor-Outdoor | 14 (18.7%) | 31.26 ± 9.07 | 8 (5.0%) | 27.21 ± 7.11 | 1.12 | 0.001 |
| Homemakers | 0 (0%) | - | 74 (46.3%) | 18.87 ± 6.35 | - | 0.002 |
| Outdoor Workers | 26 (34.7%) | 43.02 ± 14.81 | 14 (8.8%) | 36.84 ± 11.28 | 3.14 | 0.003 |
3.5 Assessment of Knowledge about Vitamin D
Table 5 summarizes the participants' knowledge about vitamin D and its association with demographic factors. Overall, knowledge levels did not differ significantly by gender (p=0.929), with both males (37.3%) and females (38.1%) showing almost similar proportions of knowledge. However, age showed a significant association with knowledge levels (t = -1.962, p = 0.041), with the highest proportion of good knowledge among participants aged 18–25 years (38.1%) and the lowest among those >55 years (21.9%). A statistically significant relationship was also observed between profession and vitamin D knowledge (t = 3.456, p = 0.001). Students had the highest proportion of good knowledge (68.4%), while homemakers had the lowest (25.7%). Education level was the most strongly associated factor with vitamin D knowledge (t = 6.789, p < 0.001). Participants with graduate-level education exhibited the highest proportion of good knowledge (85.2%), followed by higher secondary (61.2%) and secondary (60.3%) educated individuals. In contrast, only 19.4% of those with primary education and 38.5% of those with no formal education demonstrated good knowledge. These findings suggest that age, education level, and profession are significant determinants of vitamin D-related knowledge, while gender is not a significant factor.
Table 5. Knowledge about Vitamin D of the participants and correlations with their basic demographic determinants.
| Characteristics | Variables | Frequency (n) | Good Knowledge n (%) | Poor Knowledge n (%) | t-value | p-value |
| Gender | Female | 160 | 61 (38.1%) | 99 (61.9%) | -0.089 | 0.929 |
| Male | 75 | 28 (37.3%) | 47(62.7%) | |||
| Age (Yrs) | <18 | 28 | 9 (32.1%) | 19 (67.9%) | -1.962 | 0.041 |
| 18–25 | 21 | 8 (38.1%) | 13 (61.9%) | |||
| 26–35 | 26 | 9 (34.6%) | 17 (65.4%) | |||
| 36–45 | 40 | 11 (27.5%) | 29 (72.5%) | |||
| 46–55 | 49 | 17 (34.7%) | 32 (65.3%) | |||
| >55 | 32 | 7 (21.9%) | 25 (78.1%) | |||
| Profession | Students | 19 | 13 (68.4%) | 6 (31.6%) | 3.456 | 0.001 |
| Indoor Job | 80 | 24 (30.0%) | 56 (70.0%) | |||
| Mixed Indoor-Outdoor | 22 | 8 (36.4%) | 14 (63.6%) | |||
| Homemakers | 74 | 19 (25.7%) | 55 (74.3%) | |||
| Outdoor Workers | 40 | 12 (30.0%) | 28 (70.0%) | |||
| Educational Level | No Education | 13 | 5 (38.5%) | 8 (61.5%) | 6.789 | <0.001 |
| Primary | 36 | 7 (19.4%) | 29 (80.6%) | |||
| Secondary | 58 | 35 (60.3%) | 23 (39.7%) | |||
| Higher Secondary | 67 | 41 (61.2%) | 26 (38.8%) | |||
| Graduate | 61 | 52 (85.2%) | 9 (14.8%) |
This study demonstrates the significant role of occupational type, sunlight exposure, and education level in determining both vitamin D status and related knowledge among participants. Consistent with earlier studies [8, 9, 20], outdoor workers exhibited the highest vitamin D concentrations, likely due to prolonged exposure to ultraviolet B (UVB) rays. In contrast, indoor workers-particularly females-showed the lowest levels, which may reflect restricted sunlight exposure owing to occupational settings and sociocultural norms, cultural clothing practices that limit skin exposure (such as wearing masks or long garments), and less participation in outdoor activities [10]. Notably, significant gender differences observed in the 36-45 and 46-55 age groups may be attributed to physiological factors such as age-related differences in cutaneous vitamin D synthesis and variations in body fat distribution [11]. Furthermore, females may use more sun protection (e.g., sunscreen, umbrellas) for cosmetic or cultural reasons, further reducing UVB exposure.
Vitamin D levels were positively associated with sun exposure durations ranging from 30 to 180 minutes per day, emphasizing the importance of adequate UVB exposure in maintaining sufficient serum 25(OH)D levels [2]. Educational attainment also emerged as a strong determinant of vitamin D knowledge. Graduates demonstrated the highest awareness (85.2%), likely reflecting improved access to health information and resources [12]. Students similarly showed elevated knowledge levels (68.4%), possibly due to formal health education. In contrast, homemakers and participants without formal education had lower awareness, indicating the need for targeted public health interventions to improve vitamin D literacy in these groups.
This study has several limitations. Its cross-sectional design restricts causal inference, and the reliance on self-reported sunlight exposure introduces the potential for recall bias. Additionally, a larger and more diverse sample could enhance the generalizability of the findings. Future studies should consider longitudinal designs and incorporate objective measurements of UVB exposure (e.g., wearable UV sensors) to validate and expand upon these results.
This study demonstrates that vitamin D status and knowledge are significantly influenced by occupation, sunlight exposure, and education. Major findings highlight significant variations in vitamin D levels and knowledge among different demographic and occupational groups in Bangladesh, with males and outdoor workers exhibiting higher vitamin D concentrations compared to females and indoor workers. Sunlight exposure was strongly correlated with improved vitamin D status, emphasizing the importance of adequate UVB exposure. Additionally, higher education levels were associated with greater vitamin D awareness, while homemakers and less-educated individuals demonstrated poorer knowledge. These findings underscore the need for targeted public health interventions, such as promoting safe sunlight exposure and implementing educational campaigns, particularly for high-risk groups like indoor workers, women, and those with limited education, to mitigate the widespread prevalence of vitamin D deficiency in similar settings. Addressing these disparities through tailored strategies could significantly improve population health outcomes.
We extend our heartfelt gratitude to all those who contributed to the successful completion of this research project. We are immensely grateful to the Hospital authority, who allowed us to interview their patient, for the collection of data.
This research was conducted with self-funding. Therefore, any kind of financial support was not received for this study.
The authors declare no conflict of interest. All aspects of this research were conducted impartially and independently. No financial or personal relationships with other people or organizations have influenced this work.
This study did not involve any experiments on human participants or animals; therefore, formal written informed consent was not required. However, oral consent was obtained from all participants prior to data collection. Moreover, ensuring the privacy and confidentiality of participants were upheld throughout the study.
 access